Monitoring and analysis involve continuous data collection, observation, and interpretation using advanced aerial platforms, sensors, and analytics tools. By capturing real-time and historical data through drones, satellites, and IoT-enabled systems, this service enables accurate assessment of assets, environments, and operations across large or hard-to-reach areas.
The analyzed data provides actionable insights for performance tracking, anomaly detection, risk identification, and informed decision-making. Monitoring and analysis help organizations improve operational efficiency, ensure safety and compliance, and respond proactively to changes by transforming raw data into meaningful intelligence.
Irrigation Management
Irrigation Management for Water Stress Zones
Overview
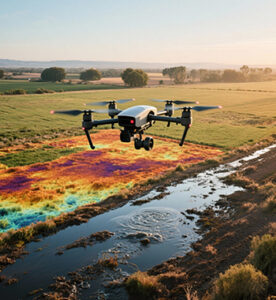
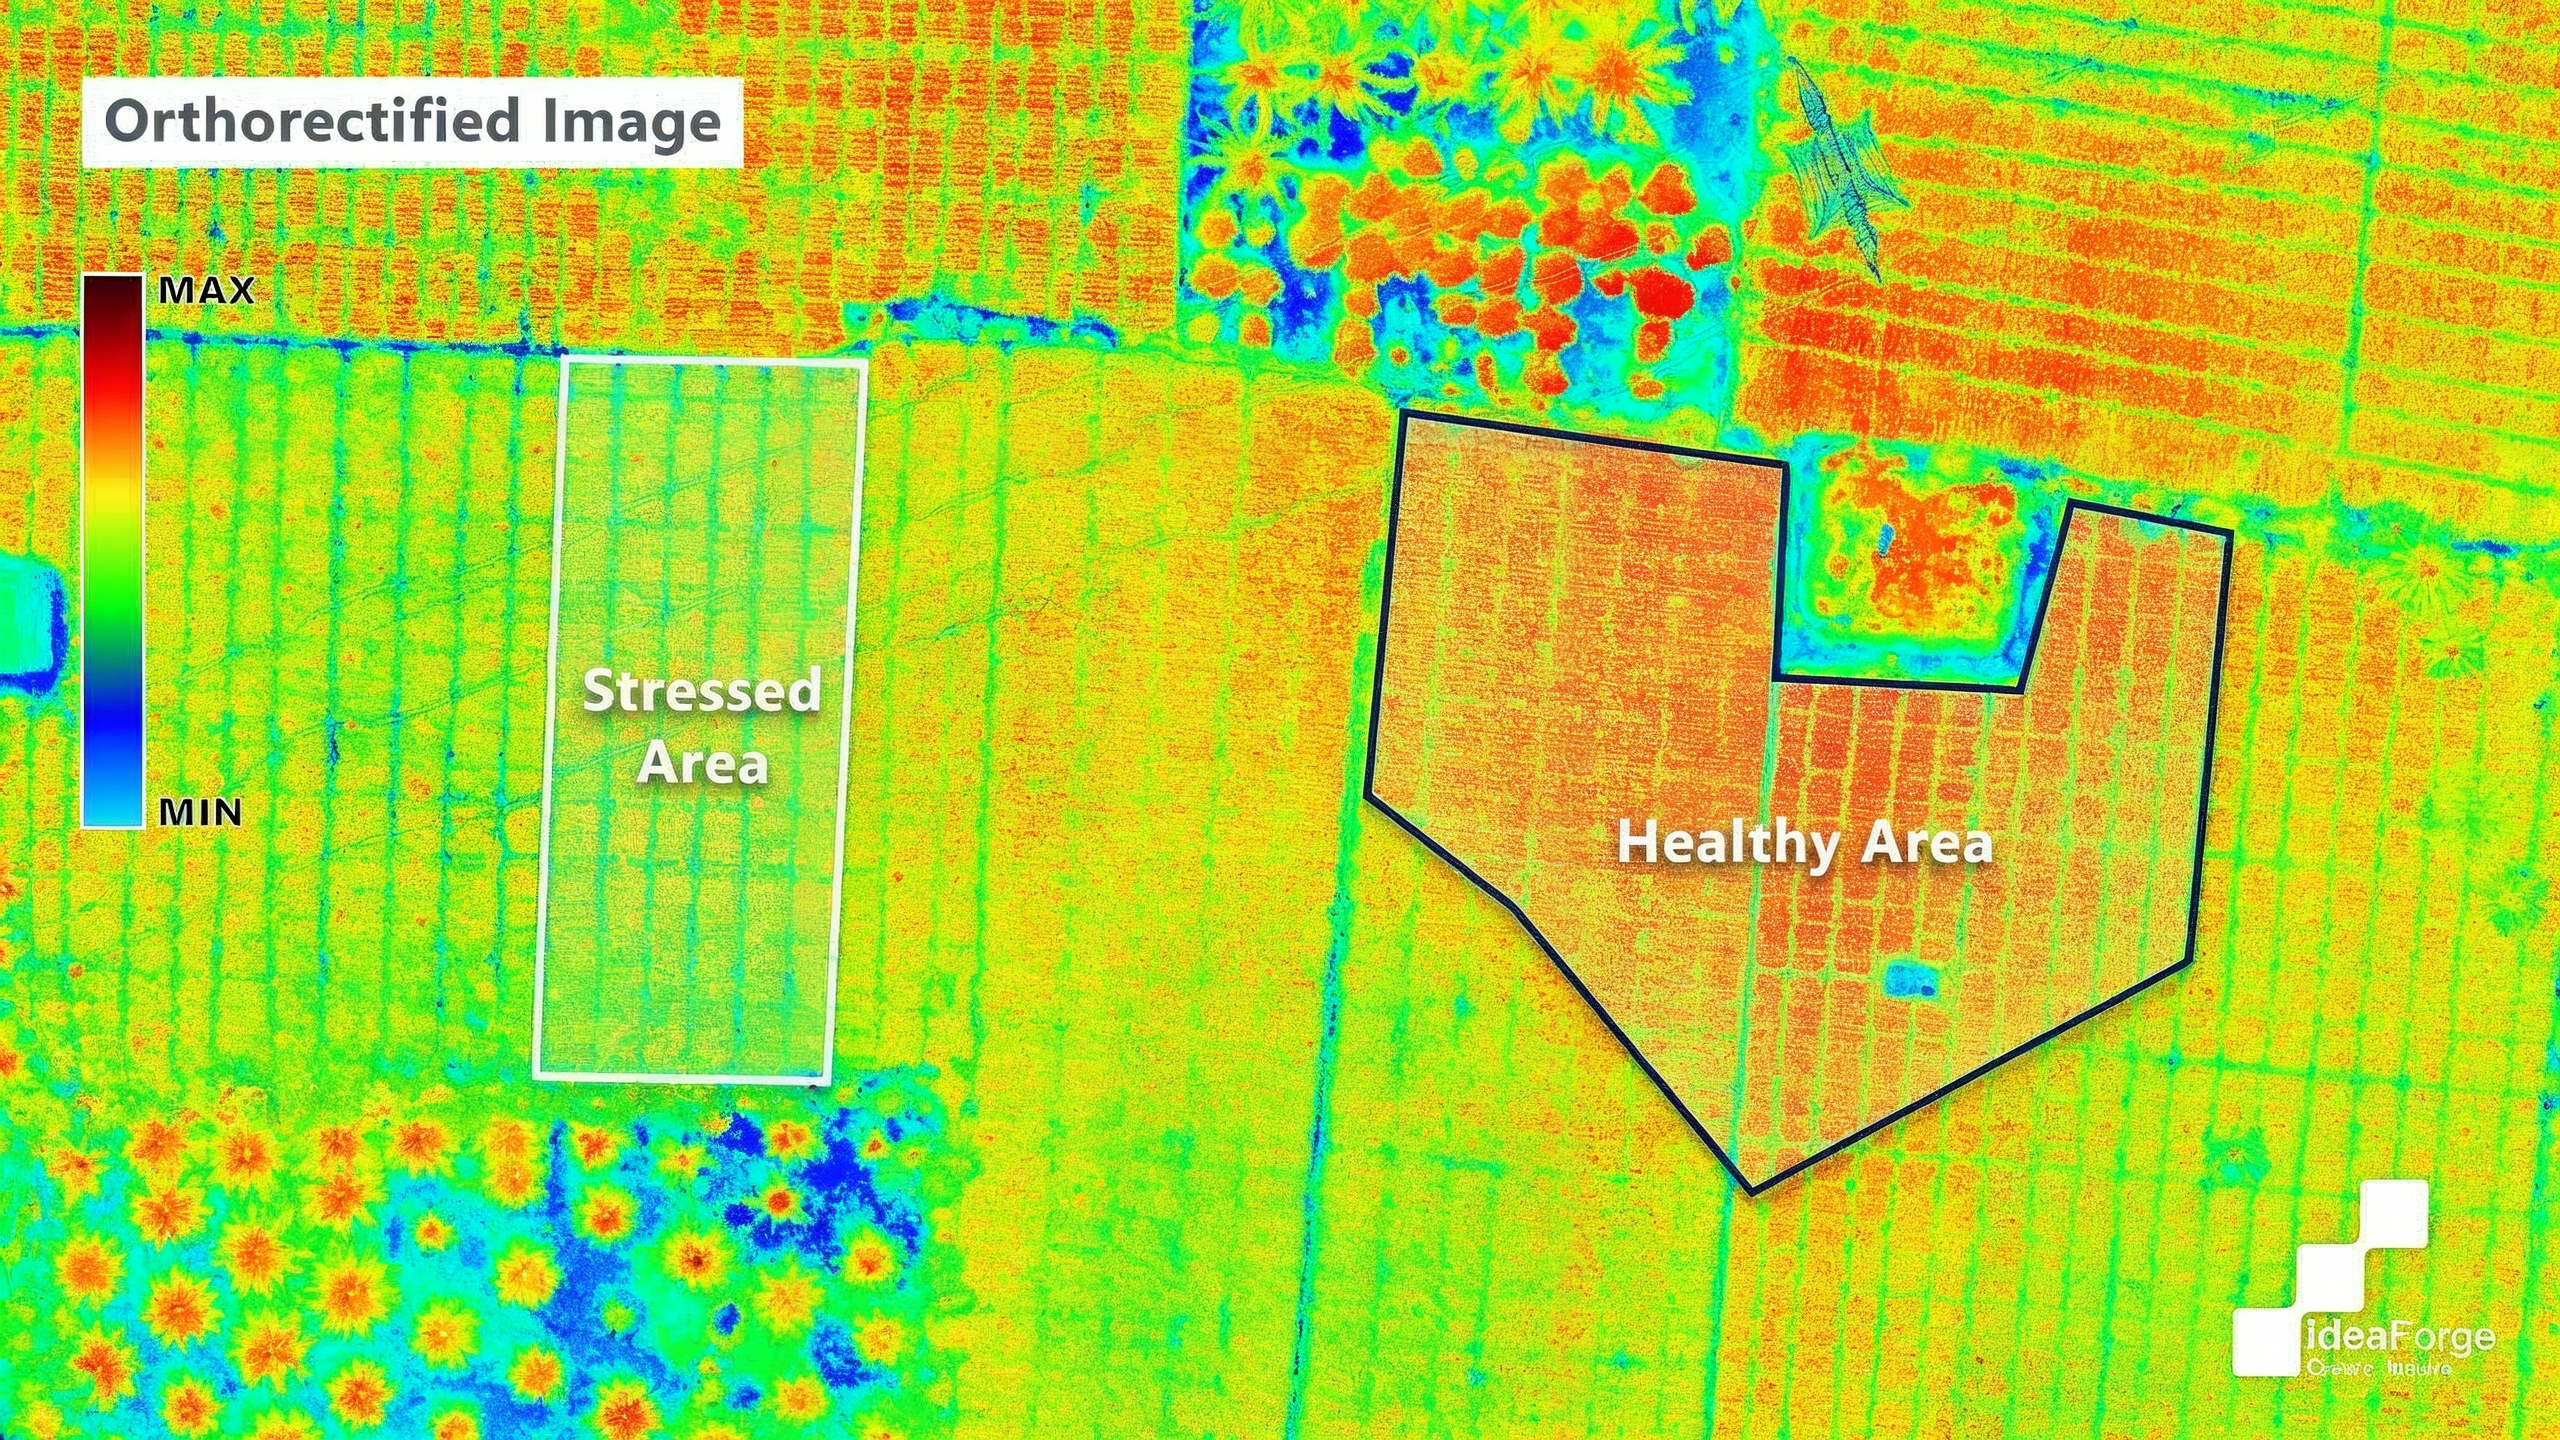
Irrigation management for water stress zones focuses on identifying areas within a field where crops are experiencing low moisture levels and require timely water supply. Using drone-based multispectral imaging, thermal maps, and soil moisture data, farmers can precisely detect dry patches, uneven water distribution, and stressed vegetation. The insights enable targeted irrigation rather than uniform watering, reducing water wastage while improving crop health and yield. This approach supports efficient water resource planning, early stress detection, and optimized irrigation scheduling for sustainable farm operations.
Process Flow
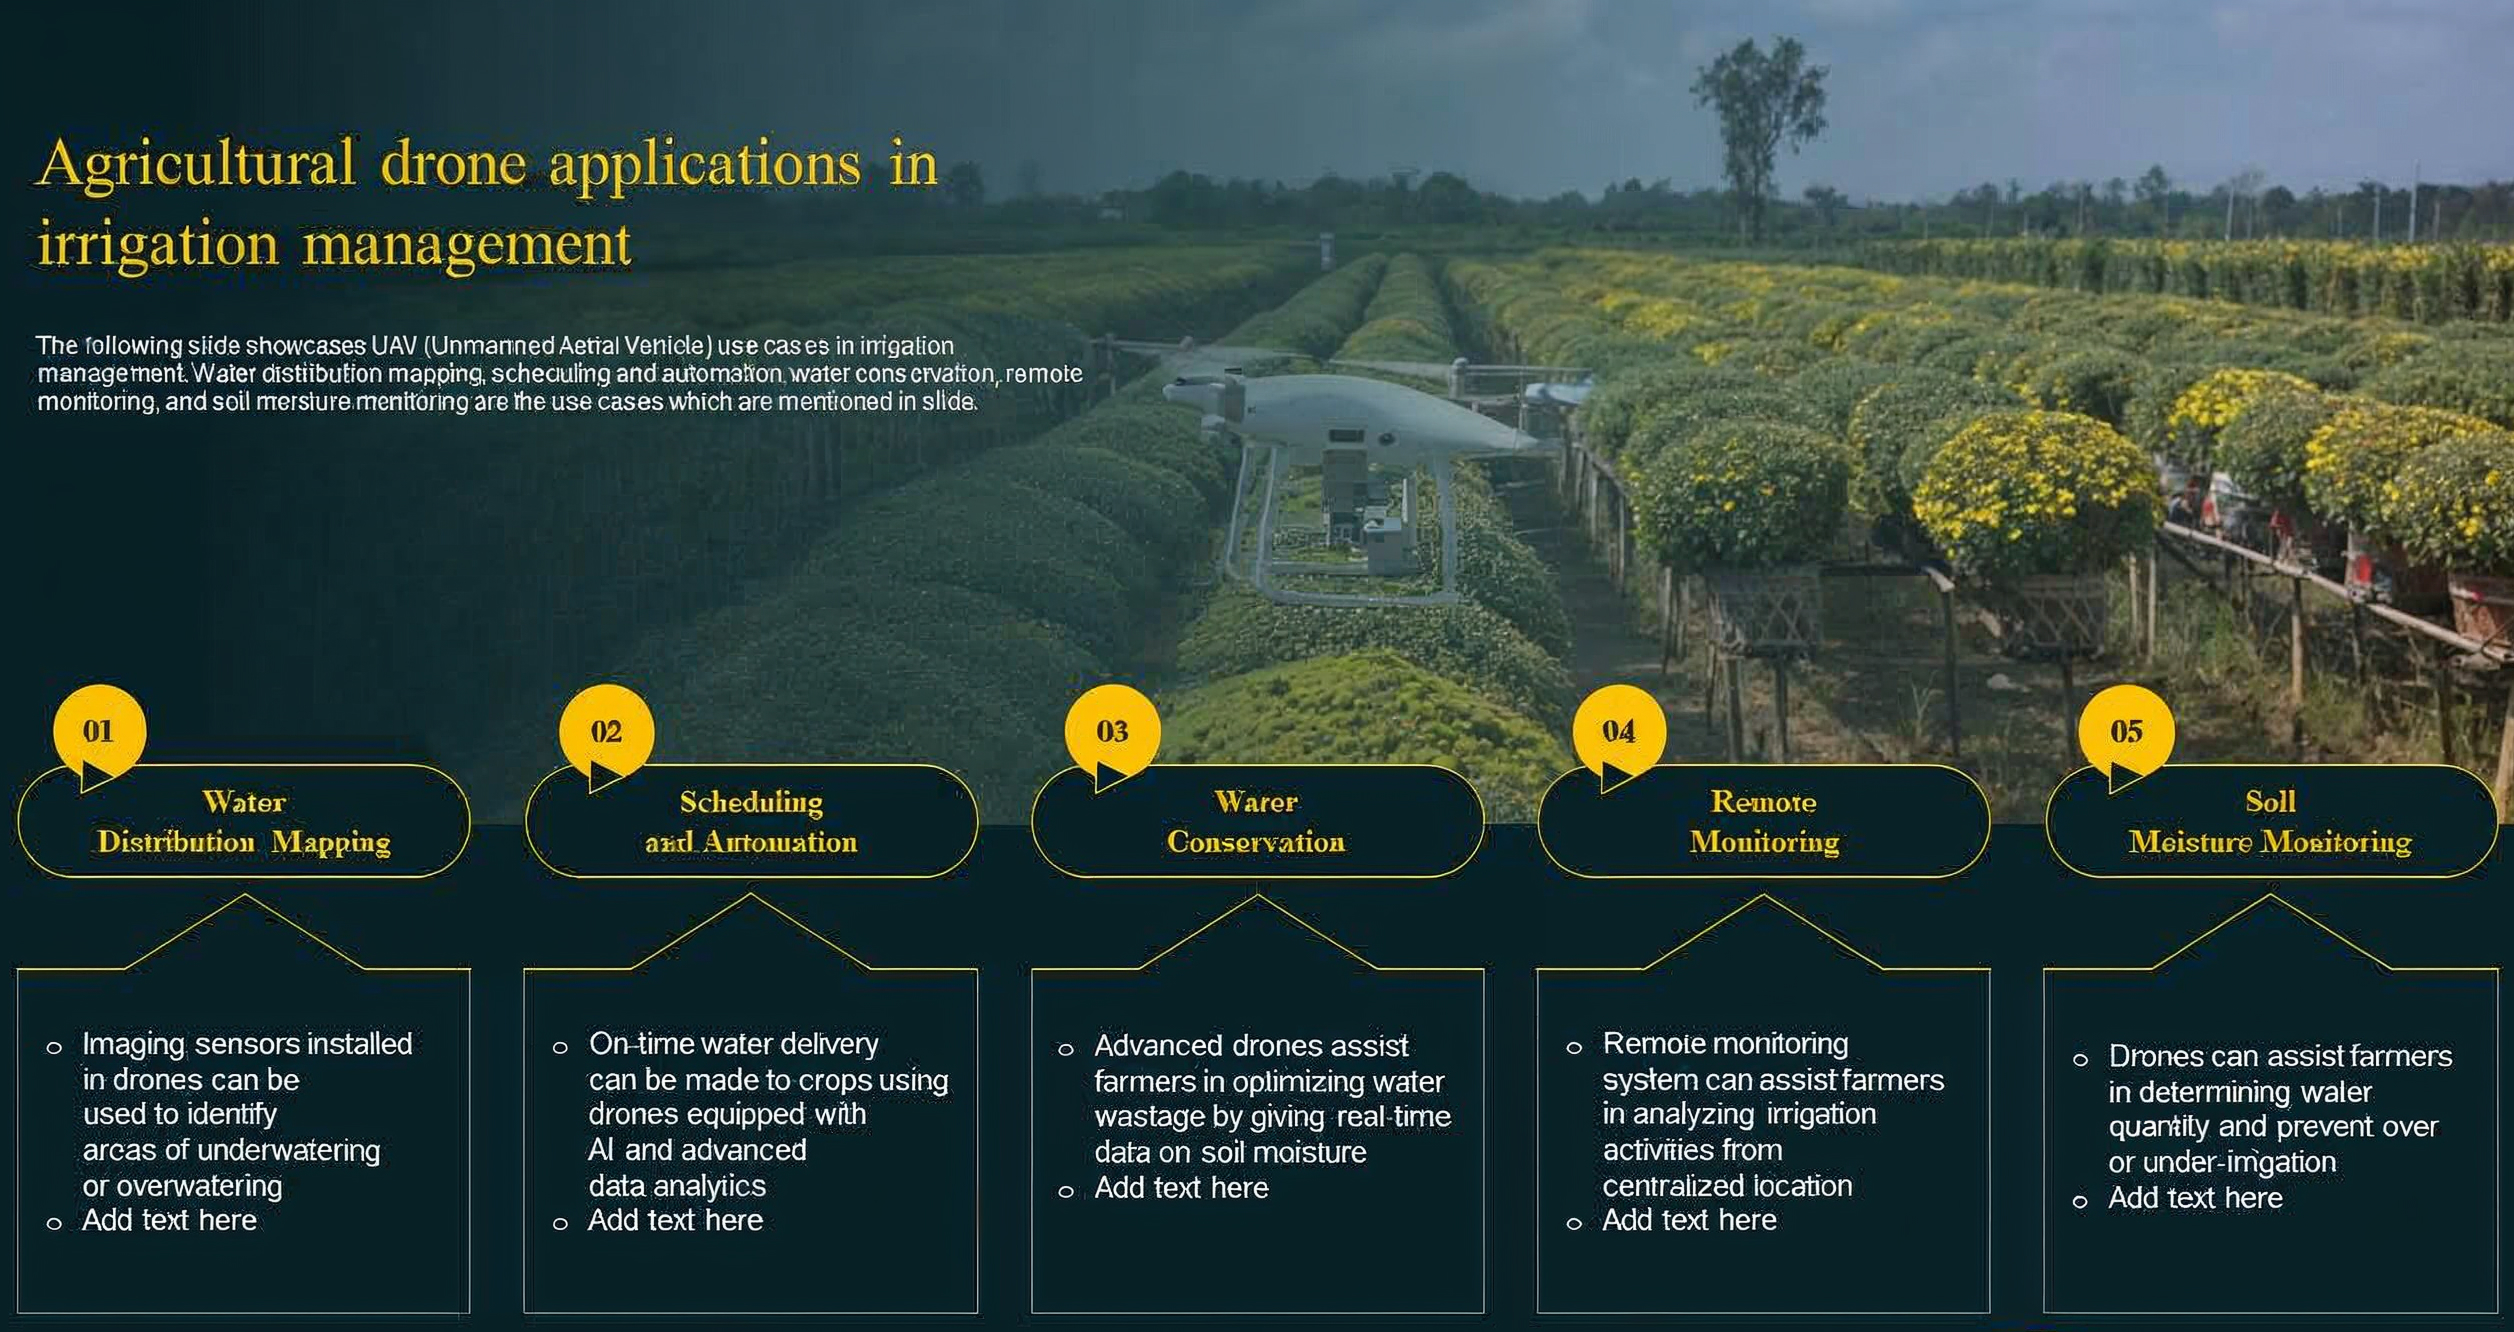
The process flow illustrates how drones streamline irrigation management through a connected, data-driven approach. It begins with water distribution mapping, where imaging sensors capture field-level variations to identify zones that are overwatered or underwatered. This data then supports scheduling and automation, enabling timely and precise irrigation based on AI-driven analysis. Using these insights, drones contribute to water conservation by optimizing water usage and minimizing wastage through real-time soil moisture intelligence. Continuous remote monitoring allows farmers to oversee irrigation activities from a centralized location, reducing manual field intervention. Finally, soil moisture monitoring ensures accurate assessment of moisture levels across the farm, helping prevent irrigation imbalances and improving overall crop health and water efficiency.
Relevant Outcomes / Deliverables
- Identifies zones facing moisture deficiency or excess to enable corrective irrigation actions.
- Ensures water is delivered exactly where needed, reducing wastage and improving irrigation efficiency.
- Uses real-time field insights to automate or refine watering intervals for higher consistency.
- Minimizes unnecessary water usage, lowering operational costs and preserving water resources.
- Supports uniform plant growth by maintaining ideal moisture levels across all field zones.
- Provides continuous aerial updates, reducing manual field checks and improving decision accuracy.
- Builds historical moisture and stress profiles to track improvement, degradation, and irrigation performance trends year over year.
Achievable Accuracy
| Parameter | Achievable Accuracy |
|---|---|
| Water Stress Zone Detection | 95% |
| Soil Moisture Variation Mapping | 90% |
| Water Distribution Pattern Identification | 90% |
| Irrigation Scheduling Precision | ±10–15% variance from ideal timing |
Key Advantages
- Provides precise identification of water-stressed zones for targeted irrigation.
- Reduces water wastage through optimized and data-driven watering decisions.
- Enhances crop health by maintaining consistent moisture levels across the field.
- Minimizes manual field inspections with continuous aerial monitoring.
- Improves irrigation scheduling accuracy using real-time moisture and stress insights.
- Increases overall farm productivity by preventing under- and over-irrigation.
Compatible Drone Platforms
- Dristi
- Dristi Pro
Supported Sensors / Payloads
- Thermal infrared camera
- Multispectral sensor for vegetation stress mapping
- GIS analytics software
Industry Segments Benefited
- Agriculture & Farming
- Horticulture & Plantations
- Agri-Research Institutions
- Irrigation & Water Management Authorities
- Agri-Tech & Smart Farming Companies
Reference
Soil Analysis and Mapping
Soil Analysis & Mapping
Overview
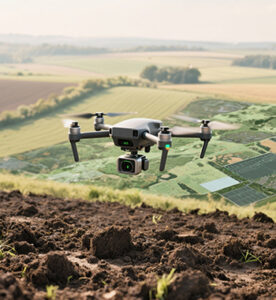
Soil analysis and mapping is a precision agriculture process that evaluates the physical, chemical, and biological properties of soil to understand its fertility, nutrient status, moisture levels, and overall productivity potential. Using sensors, laboratory tests, drones, and GIS tools, the system generates spatial soil maps showing variations across the field, enabling farmers to make data-driven decisions. These maps help in optimizing fertilizer application, irrigation planning, crop selection, and soil health improvement practices. The result is improved resource efficiency, higher yield, and sustainable field management with reduced input wastage.
Process Flow
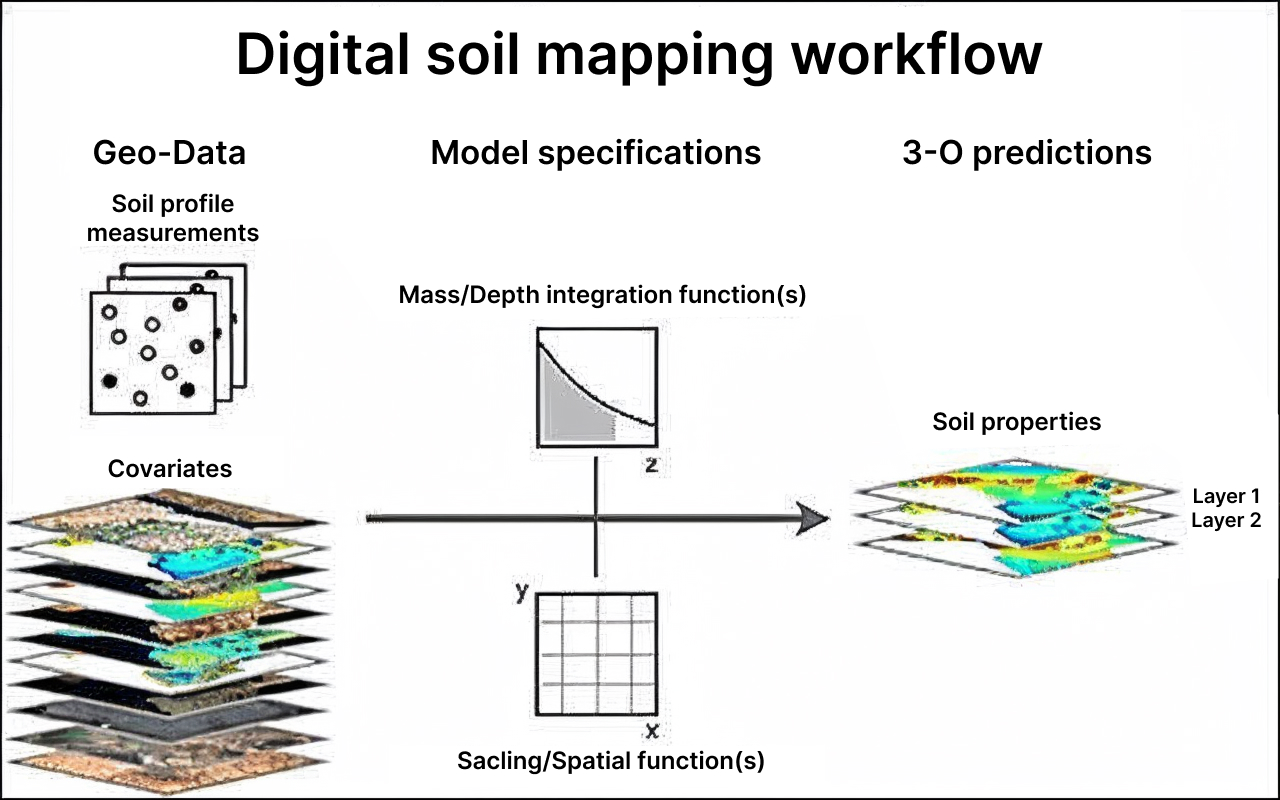
Image source : Workflow of digital soil mapping | Download Scientific Diagram
The digital soil mapping workflow begins with a drone capturing multispectral or hyperspectral imagery, elevation data, and surface reflectance, which act as spatial covariates showing variation in soil moisture, texture, organic matter, and nutrient-related signals. Along with this, a few ground soil samples are collected to provide accurate reference values. These drone layers and soil sample results are then combined in a modeling system that applies depth-integrating functions to interpret soil properties vertically (Z-axis) and spatial scaling functions to map horizontal field variability (X–Y axis). Using machine learning, the system correlates drone-derived data with measured soil values to predict soil characteristics across the entire field. The final output is a 3D soil property map showing nutrient levels, pH, EC, organic carbon, texture, and moisture for different soil depths, enabling precision decisions for fertilization, irrigation, and soil health management.
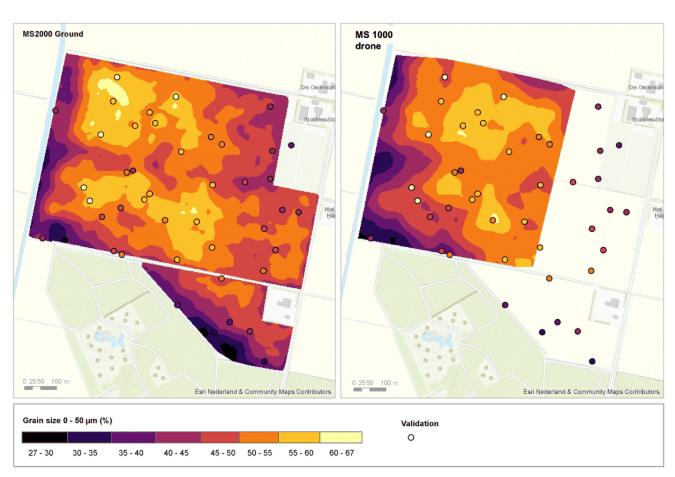
Reference Image
- Process Flow of soil mapping and analysis using drone – Search ImagesDrone for Agriculture
- Drone Use for Various Fields Like Research Analysis, Safety,rescue, Terrain Scanning Technology, Monitoring Stock Image – Image of innovation, agritech: 101333669
- Soil mapping with drones | GIM International
Relevant Outcomes / Deliverables
- Spatial maps of N, P, K, organic carbon, pH, EC, and micronutrient variation across the field
- Identification of sandy, loamy, and clay zones with moisture variability
- Classification of fields into low, medium, and high fertility zones
- Depth-wise soil property analysis for root-zone management
- Prescriptive maps for fertilizer, lime, gypsum, and water application
- Data-driven recommendations for nutrient balance and soil structure
- Year-over-year soil health tracking
- Improved crop rotation and land management planning
Achievable Accuracy
| Parameter | Achievable Accuracy / Units |
|---|---|
| Soil Nutrient Mapping (N, P, K, OC) | 90% accuracy |
| Soil pH & EC Mapping | ±0.5 pH units / ±10% EC error |
| Soil Texture Classification | 92% accuracy |
| Soil Moisture Mapping | ±15% volumetric error |
| 3D Depth-wise Prediction | 85% accuracy |
| Fertility Zonation | 95% accuracy |
| Digital Elevation & Terrain Models | 2–10 cm vertical accuracy |
Key Advantages
- Identifies exact soil nutrient levels and deficiencies
- Enables variable-rate input application
- Supports targeted soil amendments
- Maps moisture zones for efficient irrigation
- Ensures nutrients reach the right depth and location
- Provides depth-wise soil intelligence
- Improves field uniformity through precision interventions
- Assists in crop and variety selection
- Tracks soil health trends year over year
Compatible Drone Platforms
- Dristi
- Dristi Pro
Supported Sensors / Payloads
- Multispectral or hyperspectral sensor
- GNSS module for precise positioning
- Optional ground-truth soil probe integration
Industry Segments Benefited
- Agriculture & Farming
- Agri-Tech & Precision Agriculture
- Land & Environmental Management
- Forestry & Horticulture
- Construction & Civil Engineering
- Research & Academia
Reference
Disease and Pest Detection
Disease & Pest Detection (AI Analysis)
Overview
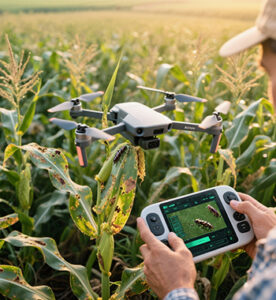
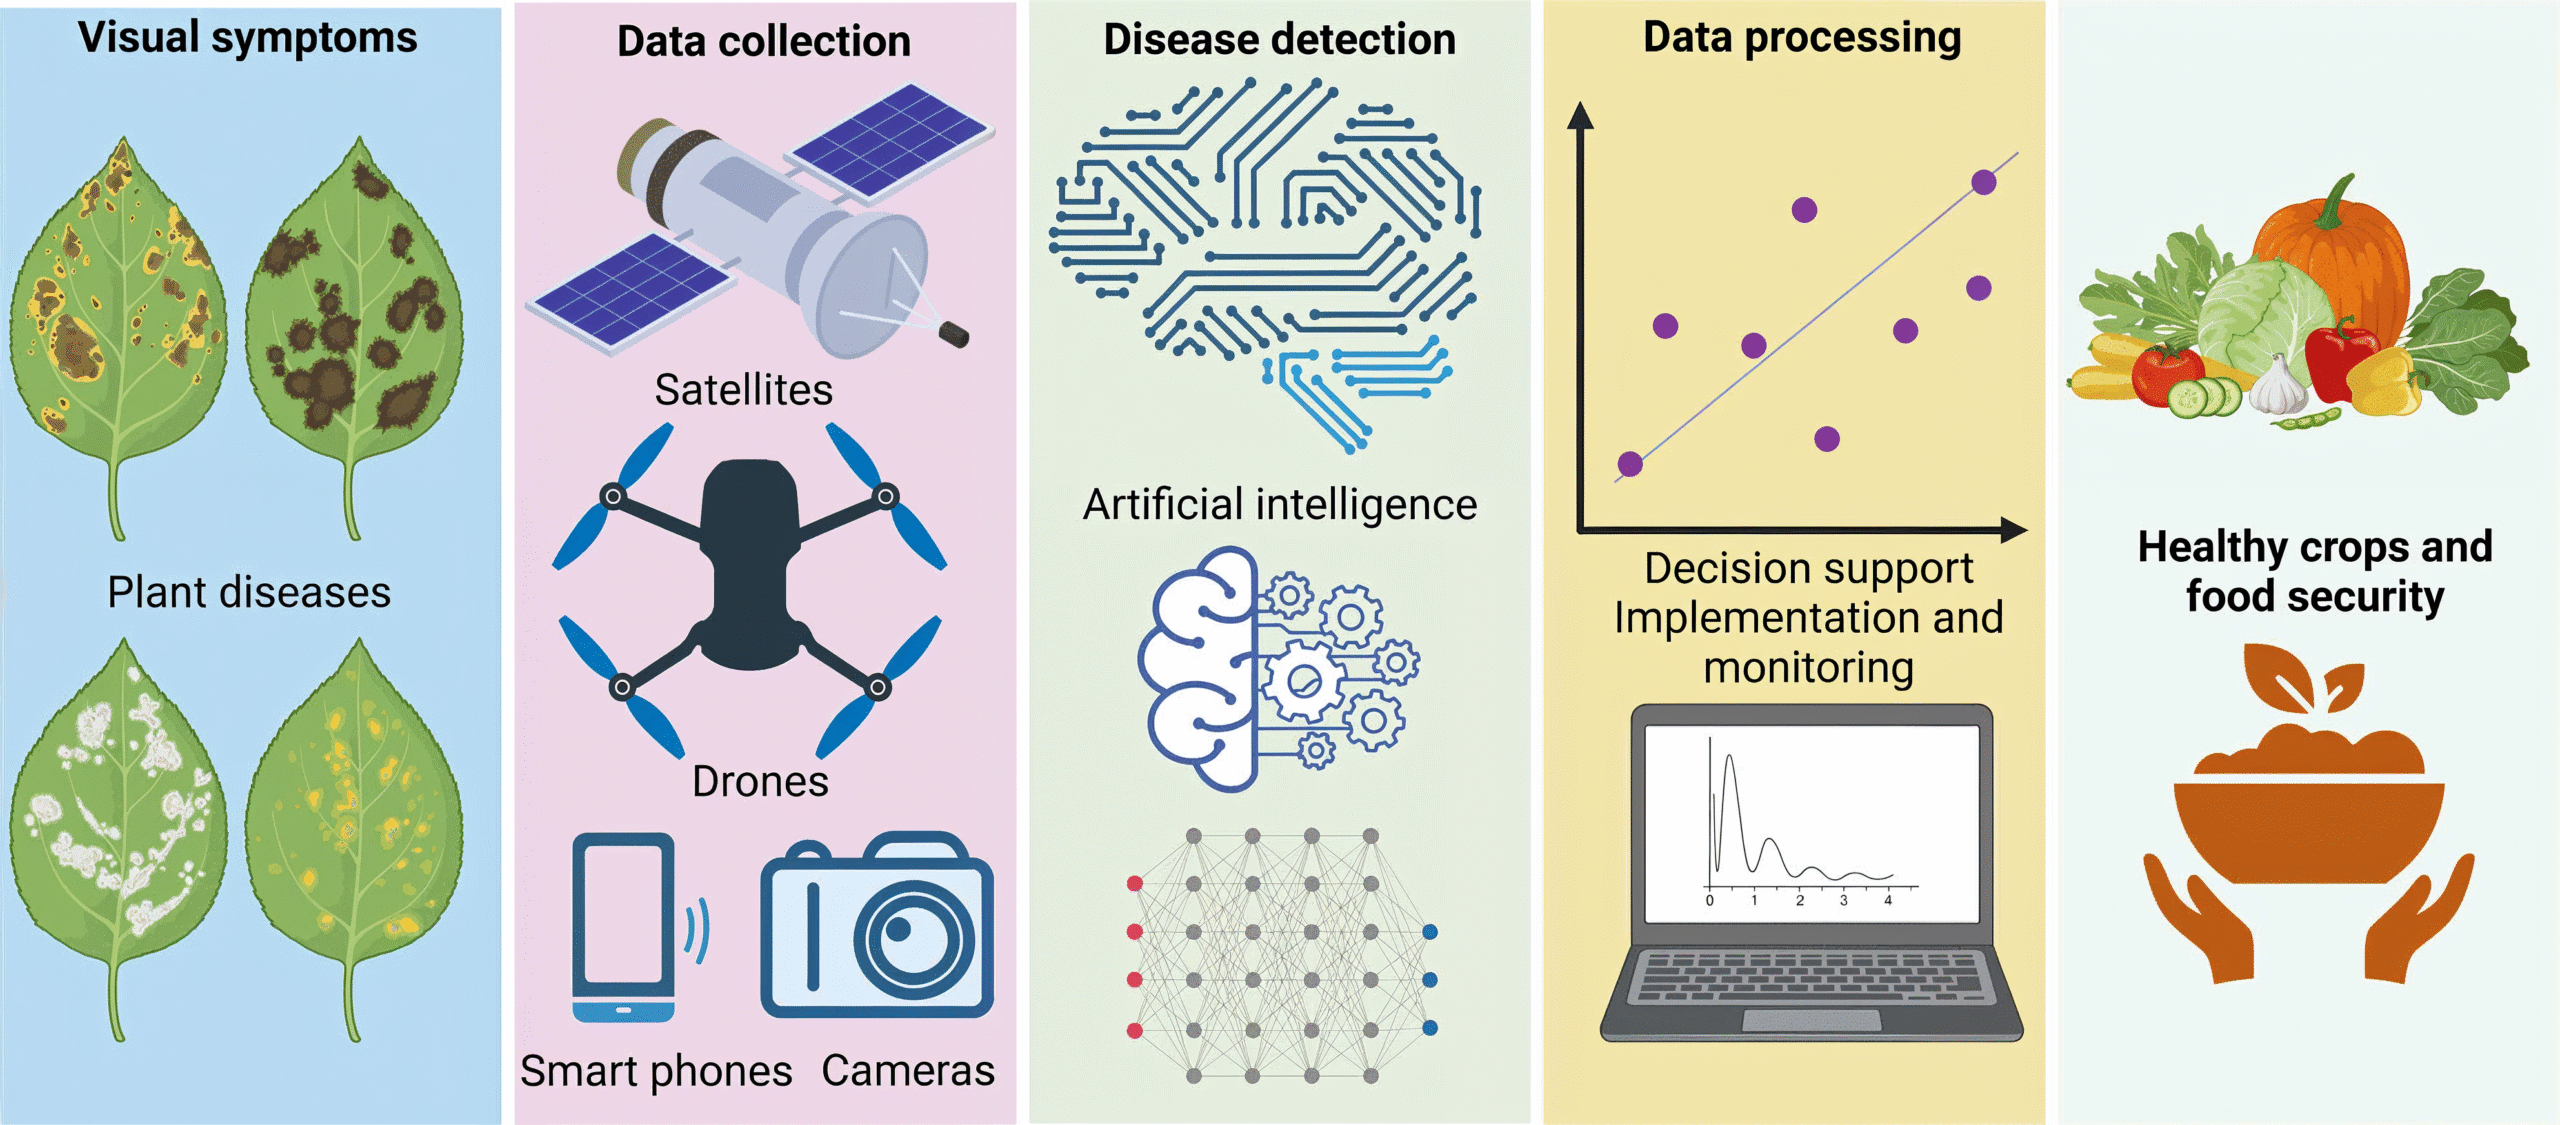
AI-driven disease and pest detection uses high-resolution drone imagery, multispectral data, and machine-learning algorithms to identify early signs of crop stress, infections, and pest infestations. By analyzing patterns such as discoloration, canopy texture changes, chlorophyll variations, and thermal anomalies, the system can detect issues long before they become visible to the human eye. This enables farmers to take rapid, targeted action—reducing crop losses, minimizing chemical usage, and improving overall field health. Automated alerts, geo-tagged reports, and severity mapping ensure precise interventions and significantly higher operational efficiency in modern precision agriculture.
Process Flow
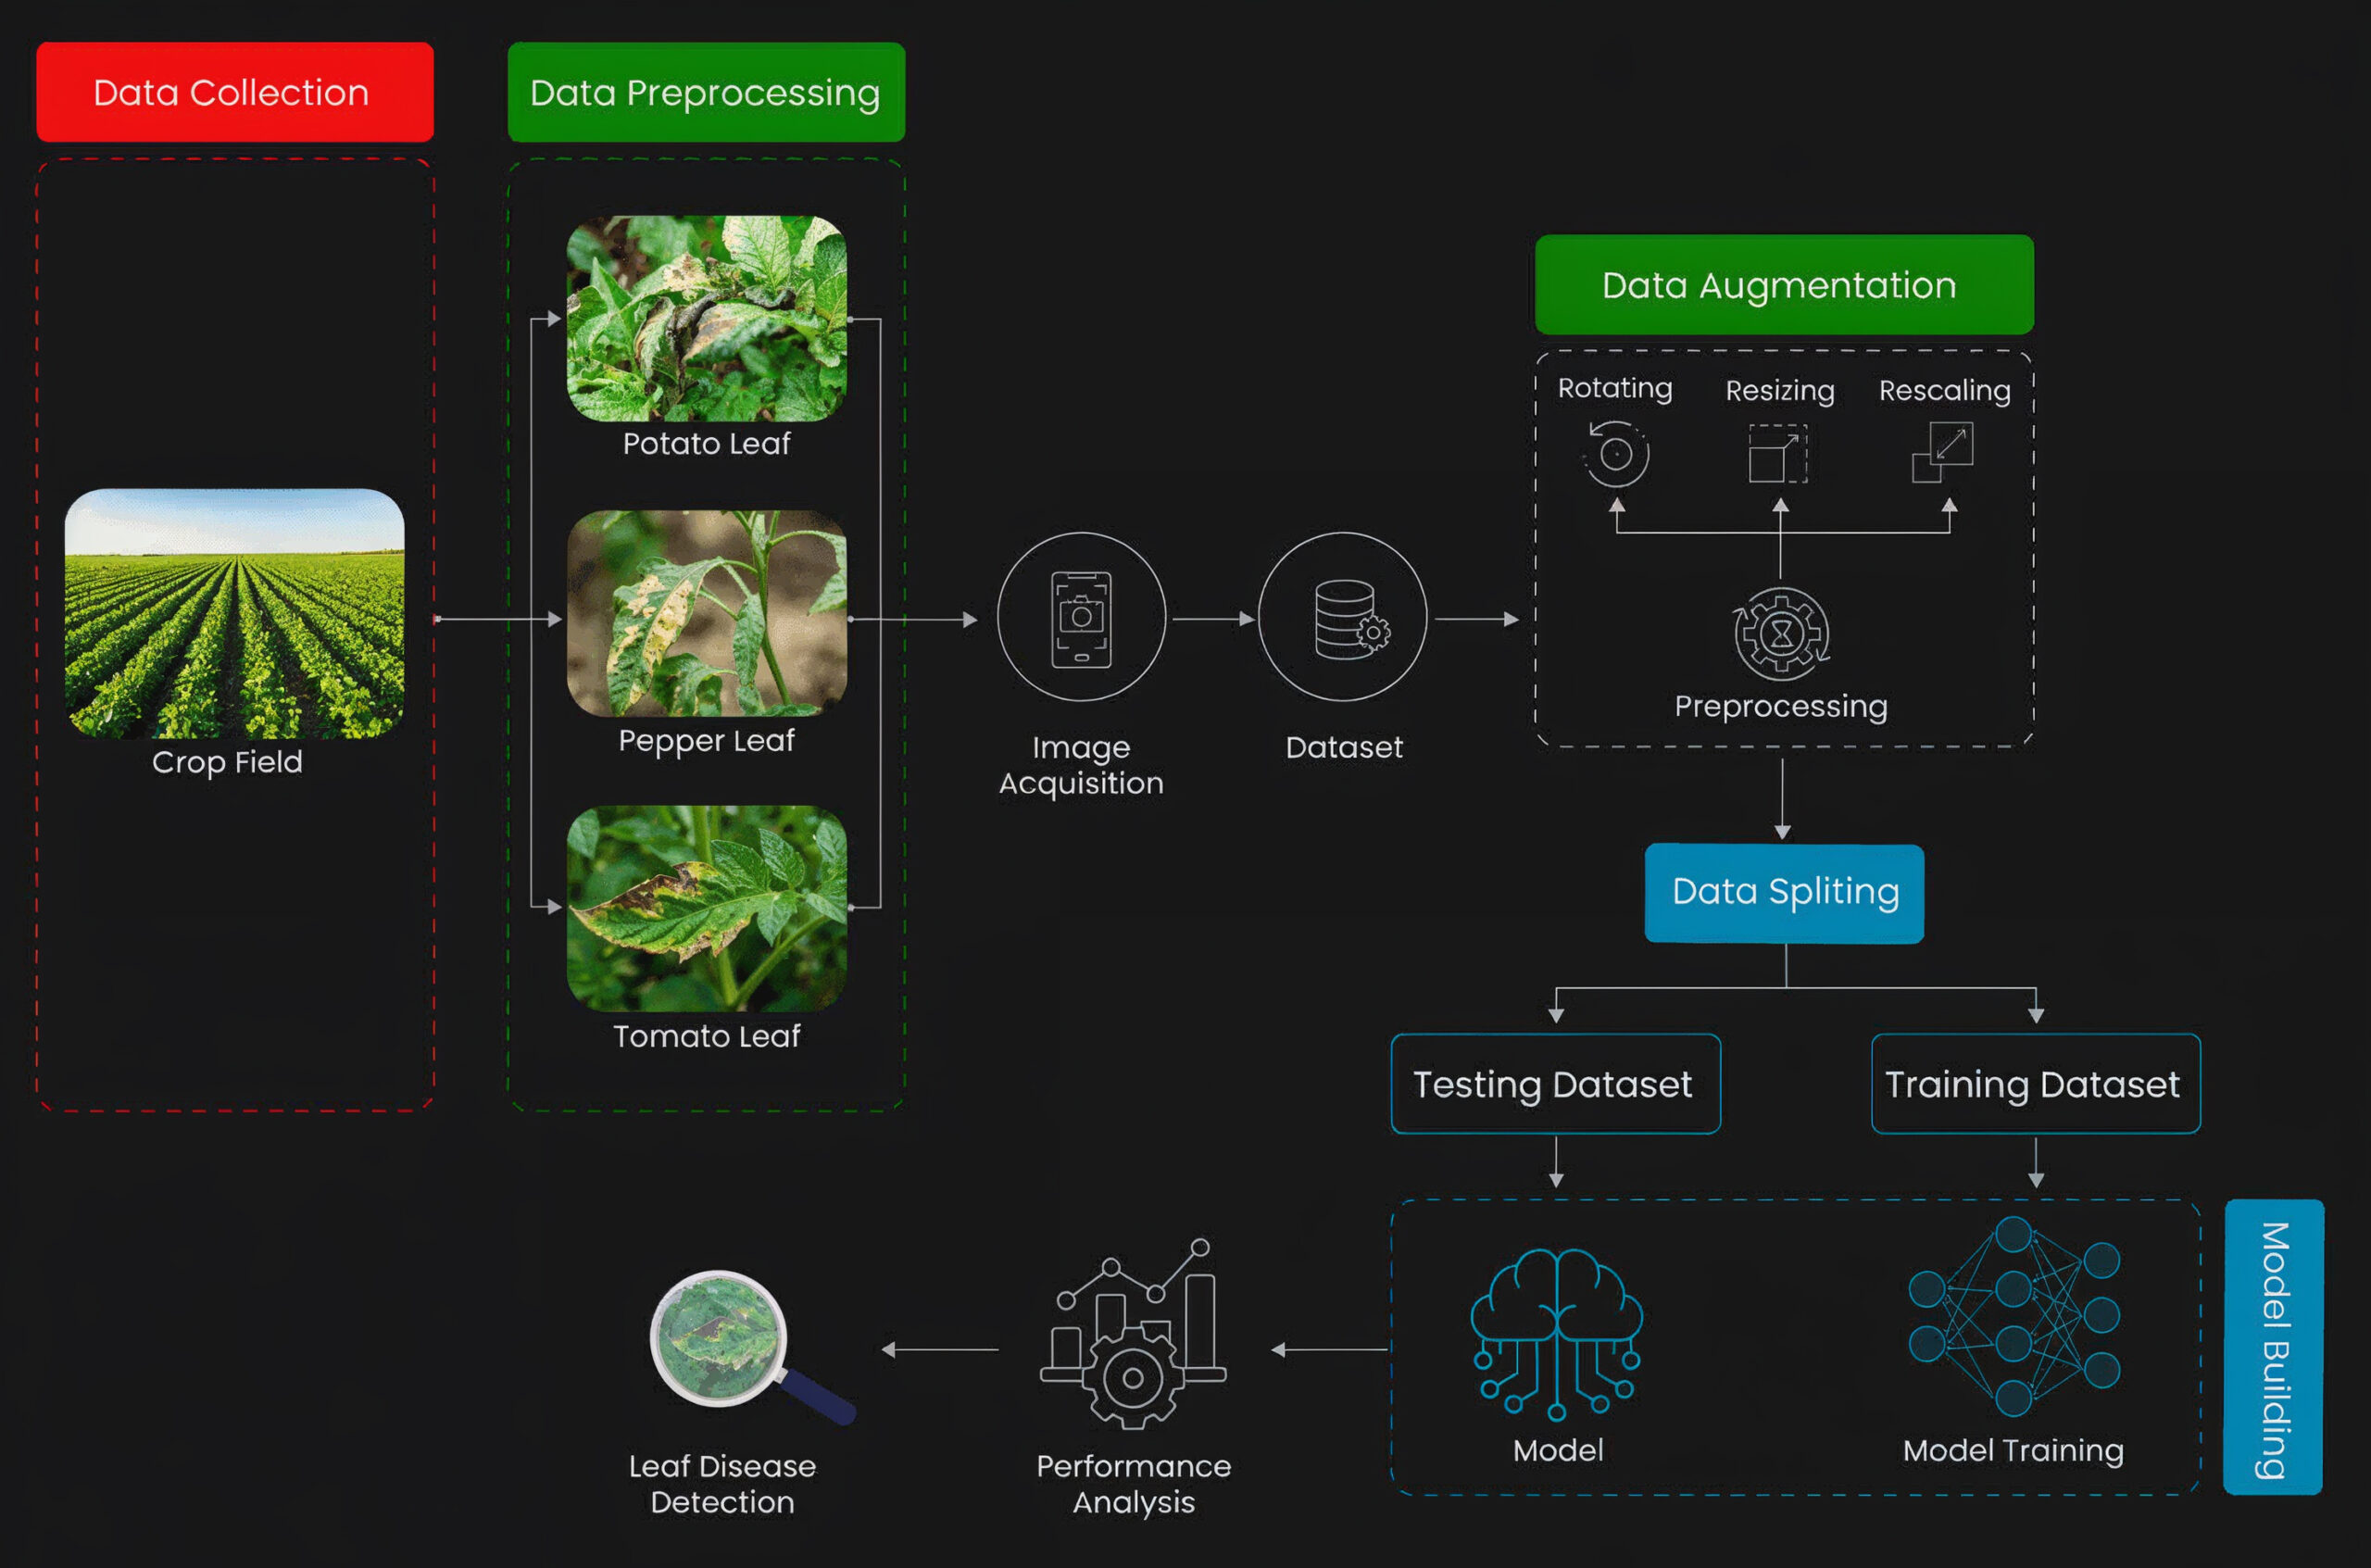
Plant Disease Detection Using Computer Vision in Agriculture | ImageVision.ai
The workflow begins with collecting leaf images directly from the crop field, capturing samples of different plants such as potato, pepper, and tomato leaves showing disease symptoms. These images undergo preprocessing to enhance clarity by adjusting lighting, removing noise, and preparing them for analysis. After image acquisition, the cleaned dataset is stored and passed through data augmentation, where images are rotated, resized, and rescaled to increase dataset diversity and improve the model’s robustness. The augmented dataset is then split into two parts: a training dataset used to train the AI model and a testing dataset used to evaluate its accuracy. The AI model learns to recognize disease patterns during training, and once trained, it processes the testing data to detect leaf diseases automatically. Finally, performance analysis is carried out to measure how well the model identifies diseases, completing the full AI-powered disease detection pipeline
Reference Image
https://bsppjournals.onlinelibrary.wiley.com/doi/10.1111/ppa.14006
Relevant Outcomes / Deliverables
- Accurate detection of infected leaf clusters, canopy stress zones, and micro-level anomalies
- Percentage of crop area affected with severity grading and pest density estimation
- Geo-fenced spray maps for drones or ground sprayers
- Unified visual outputs showing vegetation indices, stress trends, and vitality scores
- Reduced pesticide usage through targeted application
- AI-predicted crop loss versus recovery potential after treatment
- Auto-generated reports, treatment logs, and traceability records for audits
Achievable Accuracy
| Task | Accuracy / Units | Depends On |
|---|---|---|
| Disease / Pest Detection | 70% – 95% | Camera quality, lighting, crop type, disease stage |
| Disease Type Identification | 60% – 90% | Dataset size, model training quality, symptom clarity |
| Affected Area Mapping | 45% – 85% IoU | Image resolution, canopy density, leaf overlap |
| Severity Estimation | ±5% – ±20% | Sensor type, flight height, ground truth validation |
| Early Stress Detection | 65% – 92% AUC | Multispectral data, weather, time of capture |
| Pest Counting | 10% – 40% error | Pest size, motion blur, clustering, shadows |
Key Advantages
- Detects disease and pest stress before visible symptoms appear
- Pinpoints exact infected zones, reducing guesswork
- Enables pesticide application only where needed
- Prevents disease spread through early intervention
- Supports continuous drone-based field surveillance
- Minimizes manual scouting and human error
- Delivers consistent, objective AI-based analysis
- Reduces chemical, labor, and fuel costs
- Provides digital records for audits and traceability
- Generates geo-fenced maps for variable-rate spraying
Compatible Drone Platforms
- Drishti
- Drishti Pro
- Varuna
Supported Sensors / Payloads
- High-resolution RGB camera
- AI-based object detection and classification software
- Edge computing module (optional)
Industry Segments Benefited
Agriculture & Farming, Horticulture & Plantations, Agri-Tech Companies, Seed Production Companies, Crop Insurance Providers, Government & Research Institutions, Food Processing & Export Industry, Greenhouse Farming, Agrochemical Companies, Forestry & Plantation Management.
References
Crop Health Monitoring
Crop Health Monitoring (Multispectral Sensor)
Overview
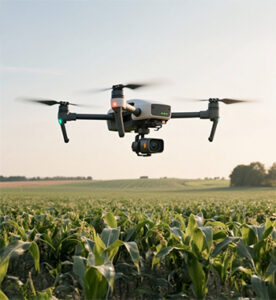
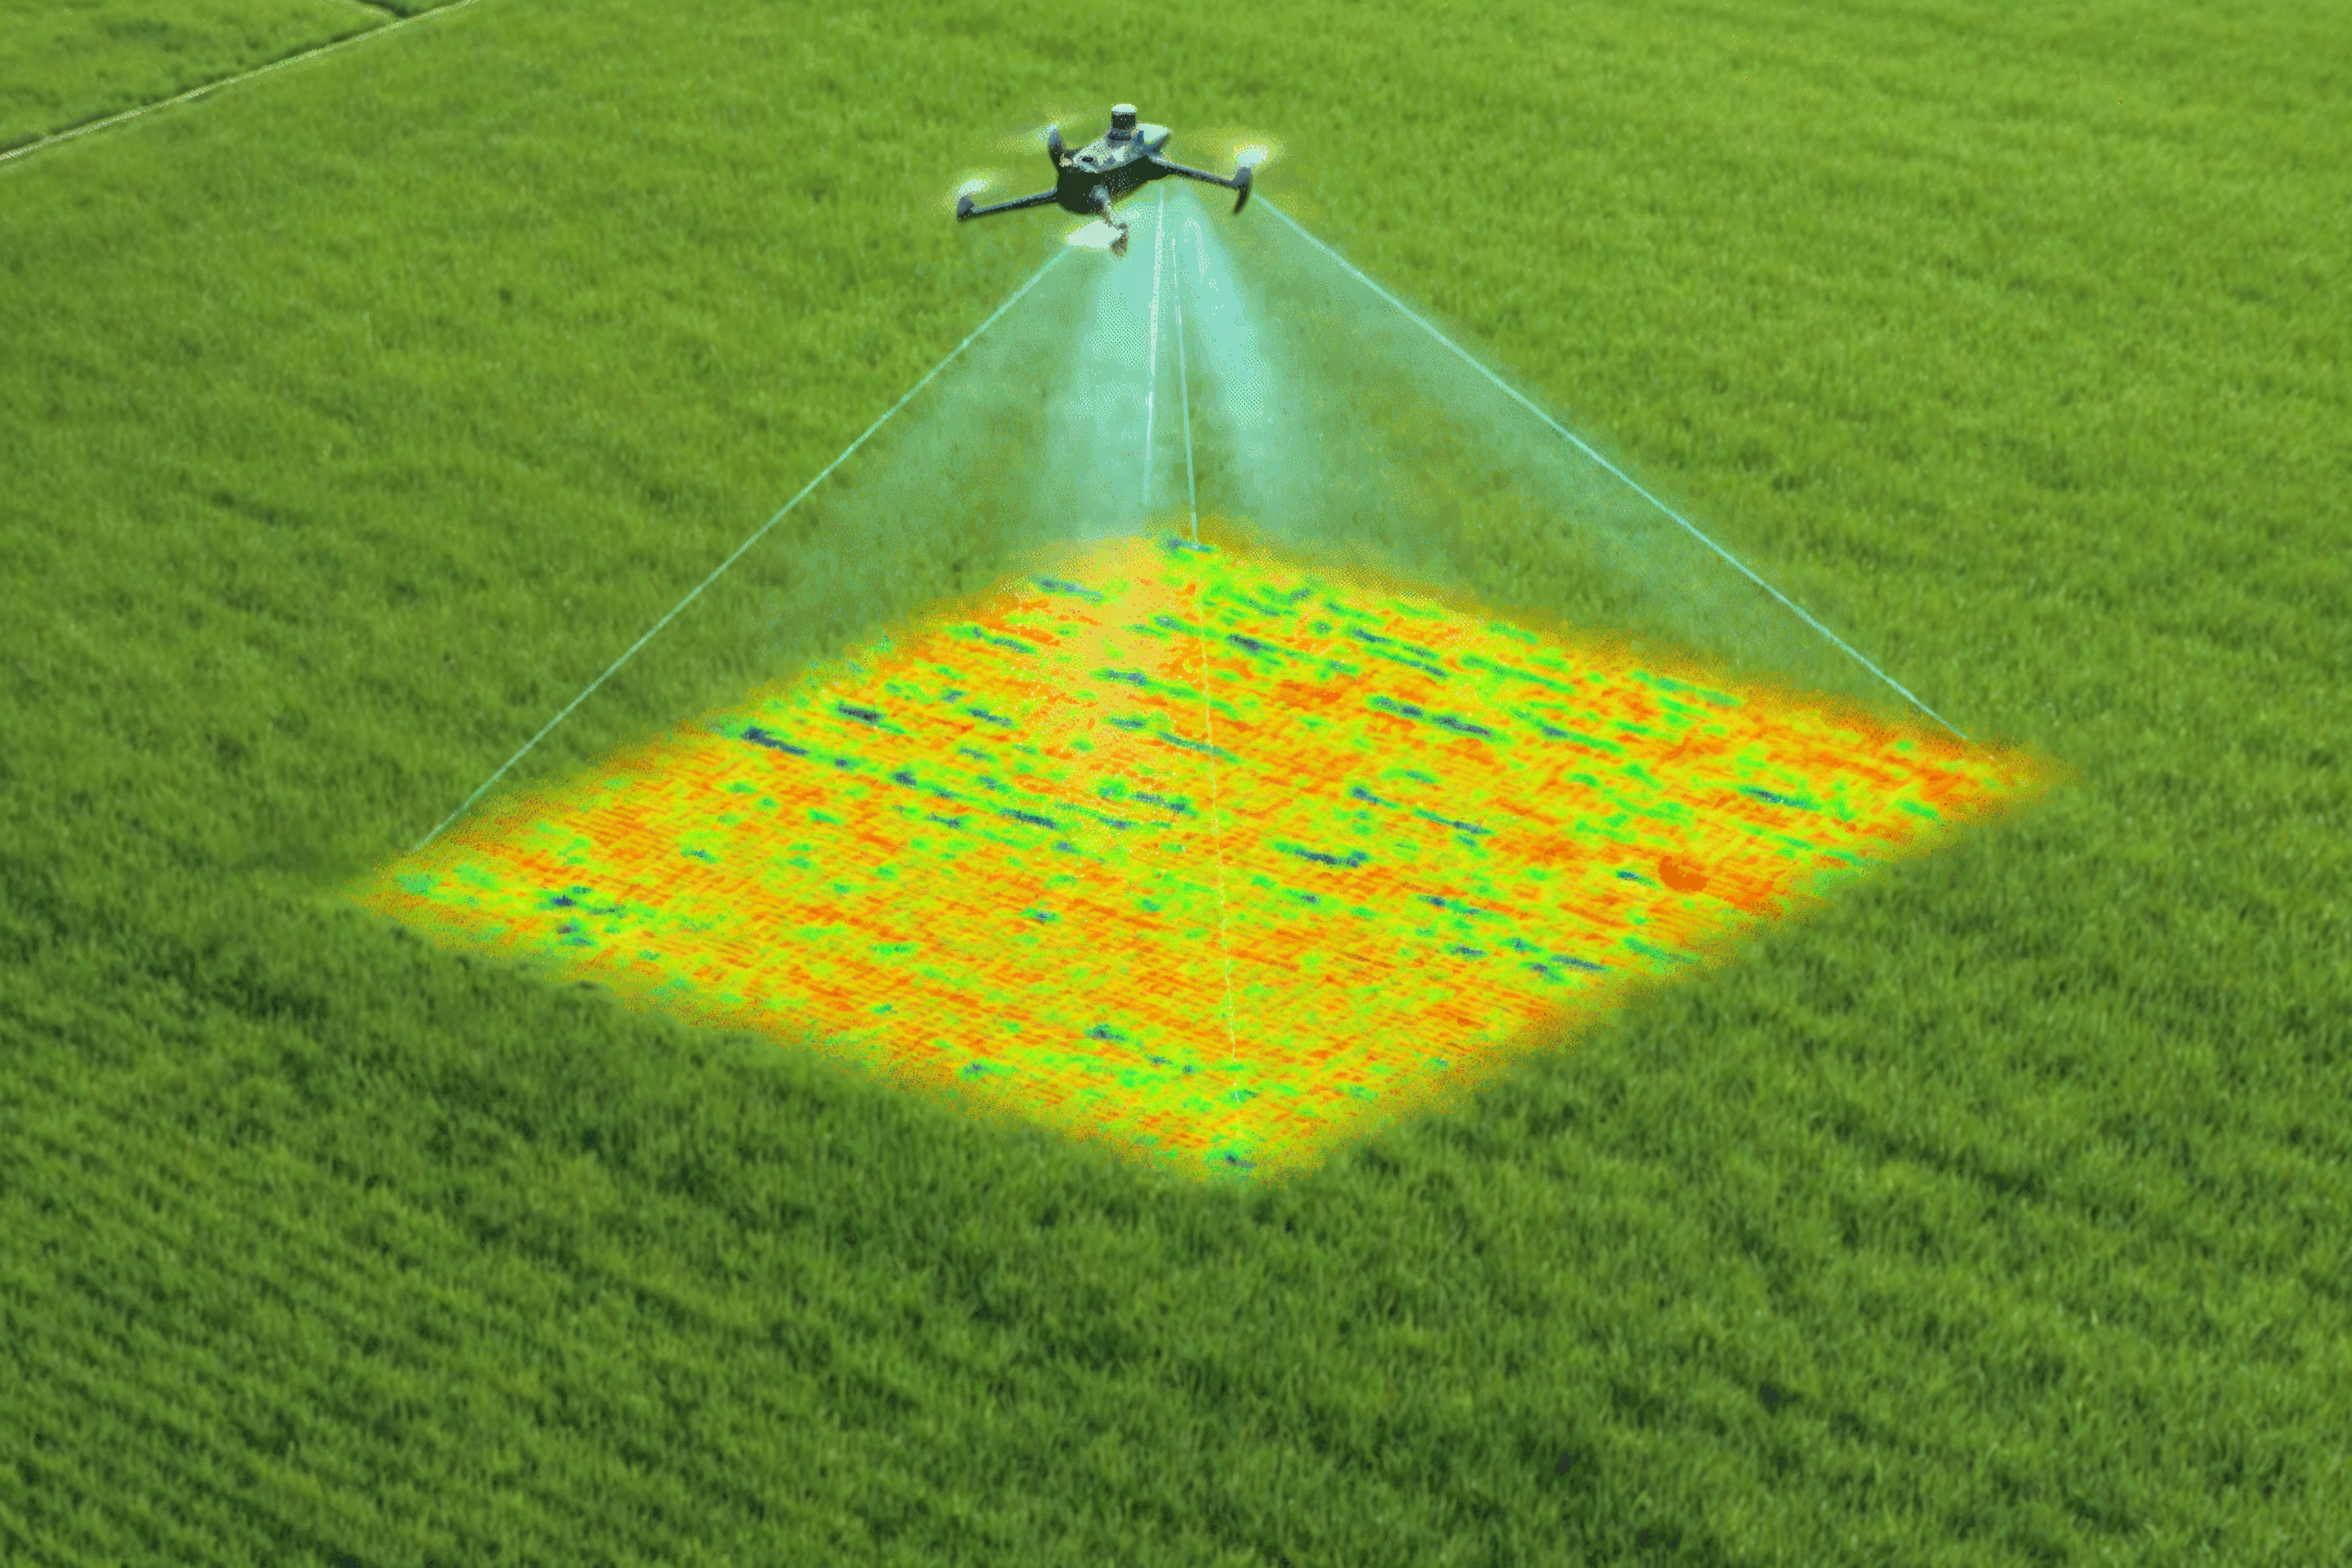
Multispectral drones provide wide-ranging applications across agriculture and environmental monitoring. In precision agriculture, they deliver detailed crop health mapping by detecting early signs of disease, pest infestation, nutrient deficiency, and water stress. This enables targeted interventions such as optimized fertilization and irrigation, improving yields while reducing resource wastage.
Process Flow
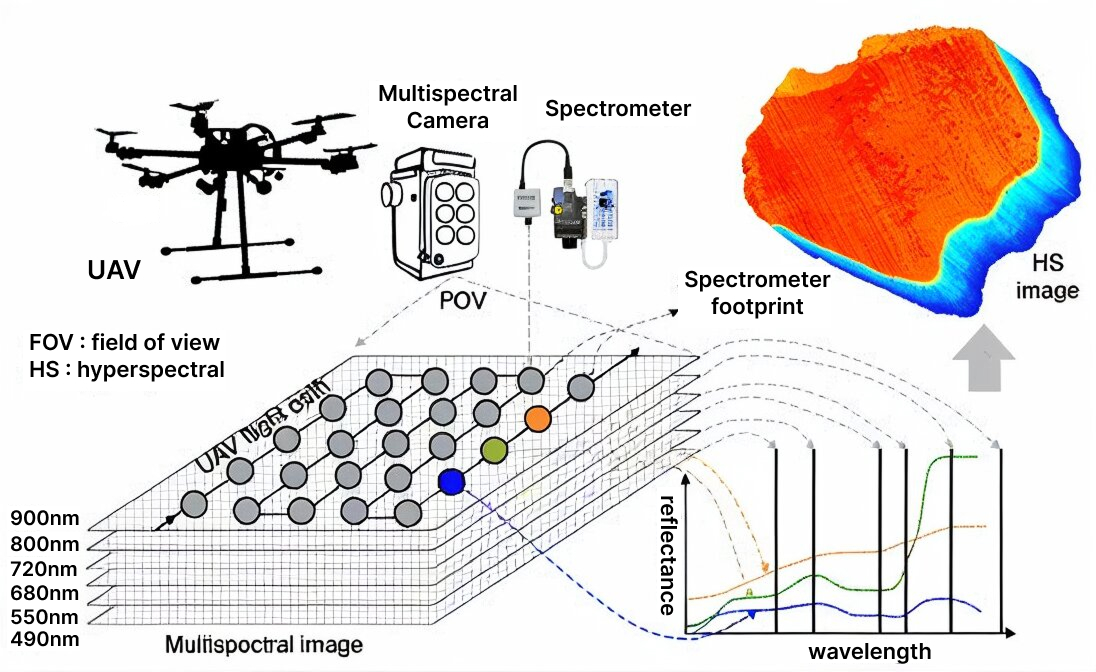
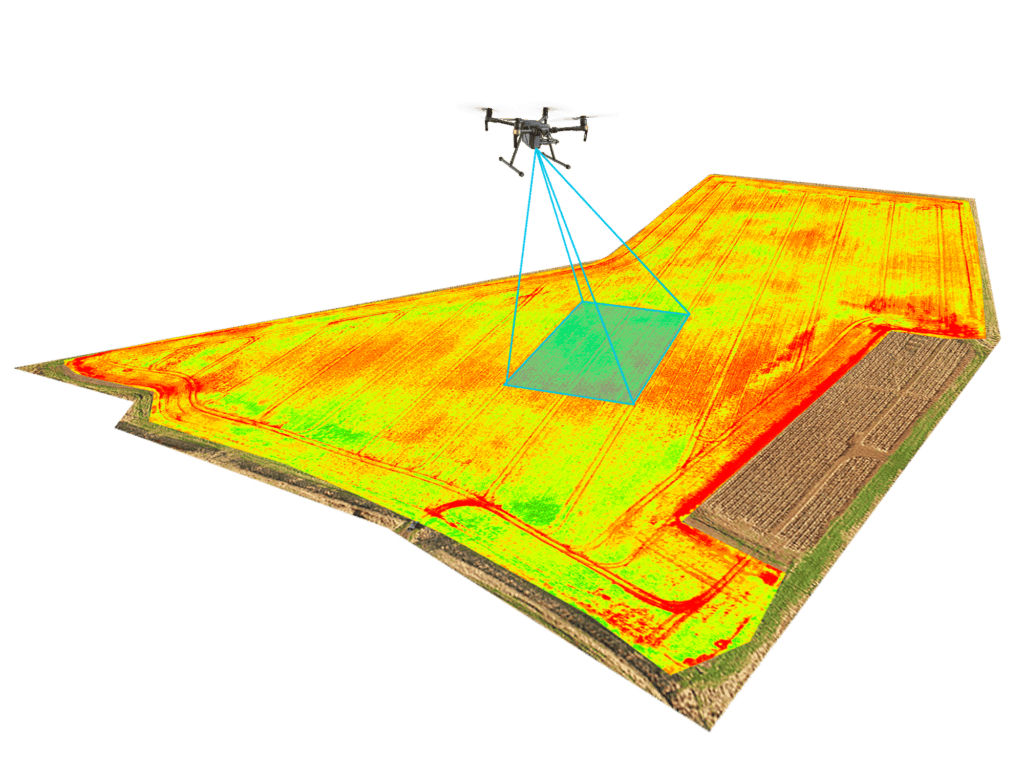
This image represents the working process of our drone equipped with a multispectral camera. As the drone flies over the target field, the multispectral camera captures images at different wavelength bands such as 490 nm, 550 nm, 680 nm, 720 nm, 800 nm, and 900 nm. These images help record the light reflectance from crops and soil in various spectral ranges. At the same time, the spectrometer collects detailed reflectance data from a specific area to maintain radiometric accuracy and ensure reliable calibration. The captured data layers are then combined to generate a image, which provides information on crop health, nutrient levels, and stress conditions. This process enables Drishti drone to deliver accurate, data-driven insights for precision agriculture and field monitoring.
Reference Images
Relevant Outcomes / Deliverables
| Deliverable | Usage |
|---|---|
| Multispectral Imagery & Maps | High-resolution images across RGB, NIR, and Red-edge bands |
| Vegetation Index Maps (NDVI, NDRE) | Quantitative assessment of crop health and stress |
| Orthomosaic Maps | Georeferenced stitched maps for spatial analysis |
| Crop Health Reports | Identification of disease zones, nutrient deficiency, and stress |
| Soil & Moisture Analysis | Evaluation of soil variability and water distribution |
| 3D Terrain & Canopy Models | Elevation, canopy height, and biomass estimation |
Achievable Accuracy
| Parameter | Typical Accuracy | Depends On |
|---|---|---|
| Radiometric Accuracy | ±3–5% | Calibration using reflectance panels |
| Spectral Band Accuracy | 1–2 pixels | Image resolution and sensor alignment |
| Sensor Accuracy | ±2–3% | Environmental and lighting conditions |
Key Advantages
- Detects crop stress, disease, and nutrient deficiencies before visible symptoms
- Enables precise fertilizer, pesticide, and irrigation application
- Covers large areas faster than manual field scouting
- Generates reliable NDVI/NDRE for plant health monitoring
- Supports forest, wetland, and ecosystem conservation
- Provides rapid assessment for disaster recovery and damage analysis
- Enables frequent monitoring with high spatial detail
Compatible Drone Platforms
- Drishti
Supported Sensors / Payloads
- Multispectral sensors (e.g., MicaSense, Sentera)
- GNSS + IMU for precise geotagging
- Cloud-based analytics platform for processing and reporting
Industry Segments Benefited
Agriculture & Precision Farming, Forestry & Ecosystem Management, Environmental Monitoring, Mining & Geology, Coastal & Marine Studies, Urban Planning & Land Management, Defense & Surveillance.
References
- Evaluation of UAV-Based RGB and Multispectral Vegetation Indices for Precision Agriculture in Palm Tree Cultivation
- A review of the application of UAV multispectral remote sensing technology in precision agriculture – ScienceDirect
- Full article: Monitoring of crop fields using multispectral and thermal imagery from UAV
- An Object-Based Image Analysis Workflow for Monitoring Shallow-Water Aquatic Vegetation in Multispectral Drone Imagery
- Weed mapping in multispectral drone imagery using lightweight vision transformers – ScienceDirect